1 INTRODUCTION
Over the past 30 years, the U.S. Geological Survey (USGS) lost many stream monitoring sites, primarily to budget cuts. To help offset the loss, they investigated using existing, publicly accessible water quality monitoring data from all 50 states to conduct nutrients trend analyses. They documented their effort in a peer-reviewed paper, “Challenges with secondary use of multi-source water-quality data in the United States” (Sprague, Oelsner, and Argue 2017). Key takeaways are:
- USGS surveyed 25 million records from 322,000 river sites and 488 environmental organizations, including federal, regional, state, tribal, county, academic, nongovernmental, volunteer, and private.
- Of those records, 14.5 million (more than half) were either missing or had unclear metadata and could not be used.
- USGS estimated that the unusable data were worth $12 billion.
2 SECONDARY DATA USE
Most environmental monitoring data are collected for a specific purpose, known as primary data use. The primary data user is familiar with their own data. Even if they don’t use a standard metadata format, they know, for example, that “nitrate” means nitrate in the NO3 form.Publicly accessible environmental data management systems (EDMS) allow for data use beyond its primary use. Using existing data for new purposes is secondary data use. This can be beneficial for many types of studies, like the USGS trend analyses. However, the data’s value is reduced if they don’t have standardized, essential metadata and valid values. If used with incorrect assumptions, these data can result in flawed or incorrect conclusions. For example, a secondary user of nitrate data wouldn’t know if it was the N or NO3 form, without proper metadata.
3 PROBLEM METADATA AREAS
USGS found issues with the following types of results-level metadata.
3.1 Parameter Name
A single parameter (characteristic; analyte) can have many names or synonyms (aliases). A parameter name can also contain additional information, such as chemical form (for example, “nitrate as N”). USGS counted 1,046 unique nutrient parameter names in the data they surveyed. They reduced these to 10 commonly monitored nutrient parameters, including ammonia, nitrate, and orthophosphate. Most names were reconciled after thorough examination, but 115 names could not be reconciled and therefore remained unique.
Example: Do “phosphorus,” and “phosphate-phosphorus” in Figure 1 mean “orthophosphate” or do they mean “total phosphorus, mixed forms”?
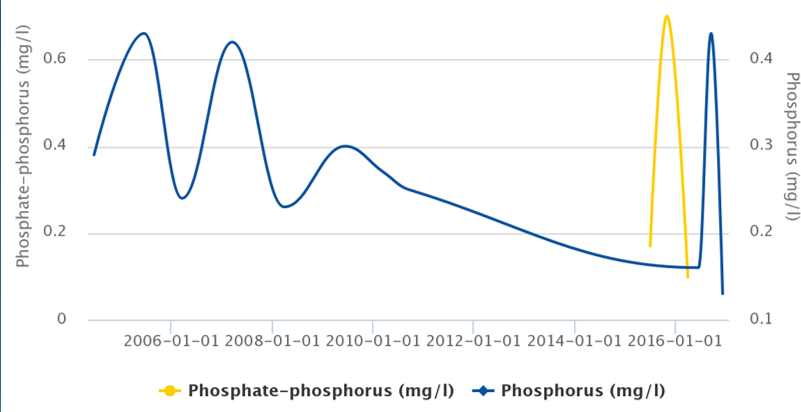
Source: Neumiller & Shumway 2017
Knowing the analytical method might help resolve some ambiguities, but it’s not always included with the data set.
3.2 Sample Fraction
Sample fraction (fraction analyzed; filtration status) is the portion of a water sample that was analyzed. Filtering or centrifuging removes particulates from water samples. Water samples may be filtered (dissolved portion), unfiltered (whole sample), or particulate (unfilterable or residual portion).
Missing or ambiguous sample fraction metadata affected roughly 12 million records (56%) in the USGS study. Sometimes it was part of the parameter name (for example, “dissolved Kjeldahl nitrogen”). Other times it was included in sample fraction codes, such as “F,” “D,” and “U” (representing filtered, dissolved, and unfiltered samples, respectively) that would not be clear to a secondary data user.
USGS also found that the use of “total” in parameter names creates ambiguity. Total can mean an unfiltered sample or a parameter made up of multiple species.
Example: Nitrogen can include ammonia (NH3), ammonium (NH4), organic nitrogen, nitrite (NO2), and nitrate (NO3). How are data users supposed to know? USGS suggested using “mixed forms” to indicate a parameter with multiple species (that is, “total nitrogen, mixed forms” instead of “total nitrogen”).
3.3 Speciation
Certain nutrient parameters—nitrate, nitrite, ammonia, and orthophosphate—can be reported in elemental or molecular forms. This is known as speciation (method speciation; chemical form).
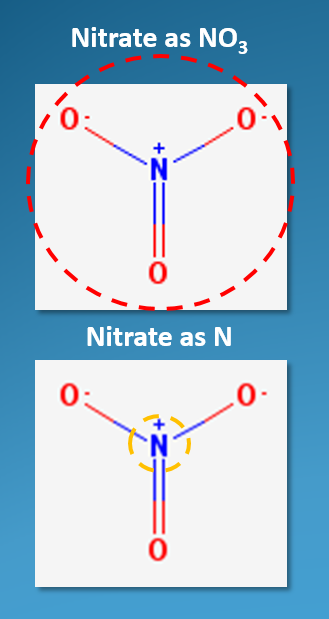
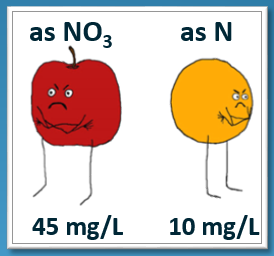
Example: For nitrate, “nitrate as NO3” is the molecular form (counts nitrogen and oxygen atoms) and “nitrate as N” is the elemental form (counts only nitrogen atoms) (Figure 2). The nitrogen atom makes up 22.5% of a nitrate molecule. 45 milligrams per liter (mg/L) of “nitrate as NO3” equals 45 mg/L × 0.225, or 10 mg/L, of “nitrate as N.” This is why the U.S. Environmental Protection Agency (USEPA) maximum contaminant level (MCL) for “nitrate as NO3” is 45 mg/L and “nitrate as N” is 10 mg/L (Figure 3).
Lab-reported speciation is independent of the analytical method. Some methods specify what form to report in, but labs don’t always follow that.
Labs often report the molecular form without any qualification (that is, nitrate missing “as NO3”). They usually indicate the elemental form (that is, “as N”). However, a secondary data user can’t assume this.
Incorrect speciation assumptions can dramatically skew data analyses because conversion factors are significant. USGS found that over 4 million records were missing or had ambiguous speciation.
Source: Neumiller & Shumway 2017
Source: Neumiller & Shumway 2017
3.4 Data Qualifiers
Data qualifiers (qualifier codes; remark codes; detection condition) explain censored data (that is, values less than reporting or detection limits). One of the most common data qualifiers is “non-detect,” a value below the detection limit. The code is usually “U.”
USGS found almost 600 unique data qualifiers or data quality remarks in the data they surveyed. Many of these were in comment fields and not a dedicated field. This makes them difficult to find. Others were ambiguous. Censored data was completely missing from the data sets of 53 organizations. All of these situations create potential bias in data analyses.
USGS found missing or ambiguous data qualifiers for 124,523 records.
3.5 Missing or Zero Values
USGS found over 600,000 records with values of zero, negative values, or censored data with no values. Because nutrient data can’t have negative values, they were assumed to be errors. Zero values aren’t possible either; these may have been non-detects. Some censored data had no values and/or detection limits or reporting limits. USGS found other combinations of ambiguous reporting as well. There was no way to confidently use this data.
4 USGS CONCLUSIONS
USGS concluded that the adoption of standardized metadata practices across organizations would dramatically increase the ability to reuse and share data. They cited these points:
- Consistently use parameter naming conventions (or create ability to accommodate synonyms).
- Limit use of “total” to parameters that contain multiple species (for example, total nitrogen, mixed forms).
- Create dedicated field for sample fraction, using valid values “filtered,” “unfiltered,” and “particulate.”
- Consistently report speciation, and units.
- Create a dedicated field for data qualifiers and adopt consistent valid values.
- Discontinue improper use of zero, negative, and missing values.
Although they didn’t evaluate it for this report, USGS mentioned the importance of documenting other information, such as geographic, sample, and laboratory methods in the metadata.
5 FURTHER ACTION
USGS’s findings lead to a year-long work group on nutrient data management. It included USGS and EPA Water Quality eXchange (WQX) staff and representatives of several state EDMSs. Their effort resulted in a document, Best Practices for Submitting Nutrient Data to the Water Quality eXchange (WQX) (USEPA 2017), which is published on the EPA WQX website.
6 REFERENCES AND ACRONYMS
The references cited in this fact sheet, and the other ITRC EDM Best Practices fact sheets, are included in one combined list that is available on the ITRC web site. The combined acronyms list is also available on the ITRC web site.

